Data Science for Assessment
Bonus Preview Session for the Assessment Institute 2024
Agenda
- Introduction & Motivation
- Ways of Doing Analysis
- Examples
- Getting Started
- Wrap-up
1 Introduction & Motivation
Thanks to the Assessment Institute for hosting this session and making it free to all.
1.1 Assessment domains


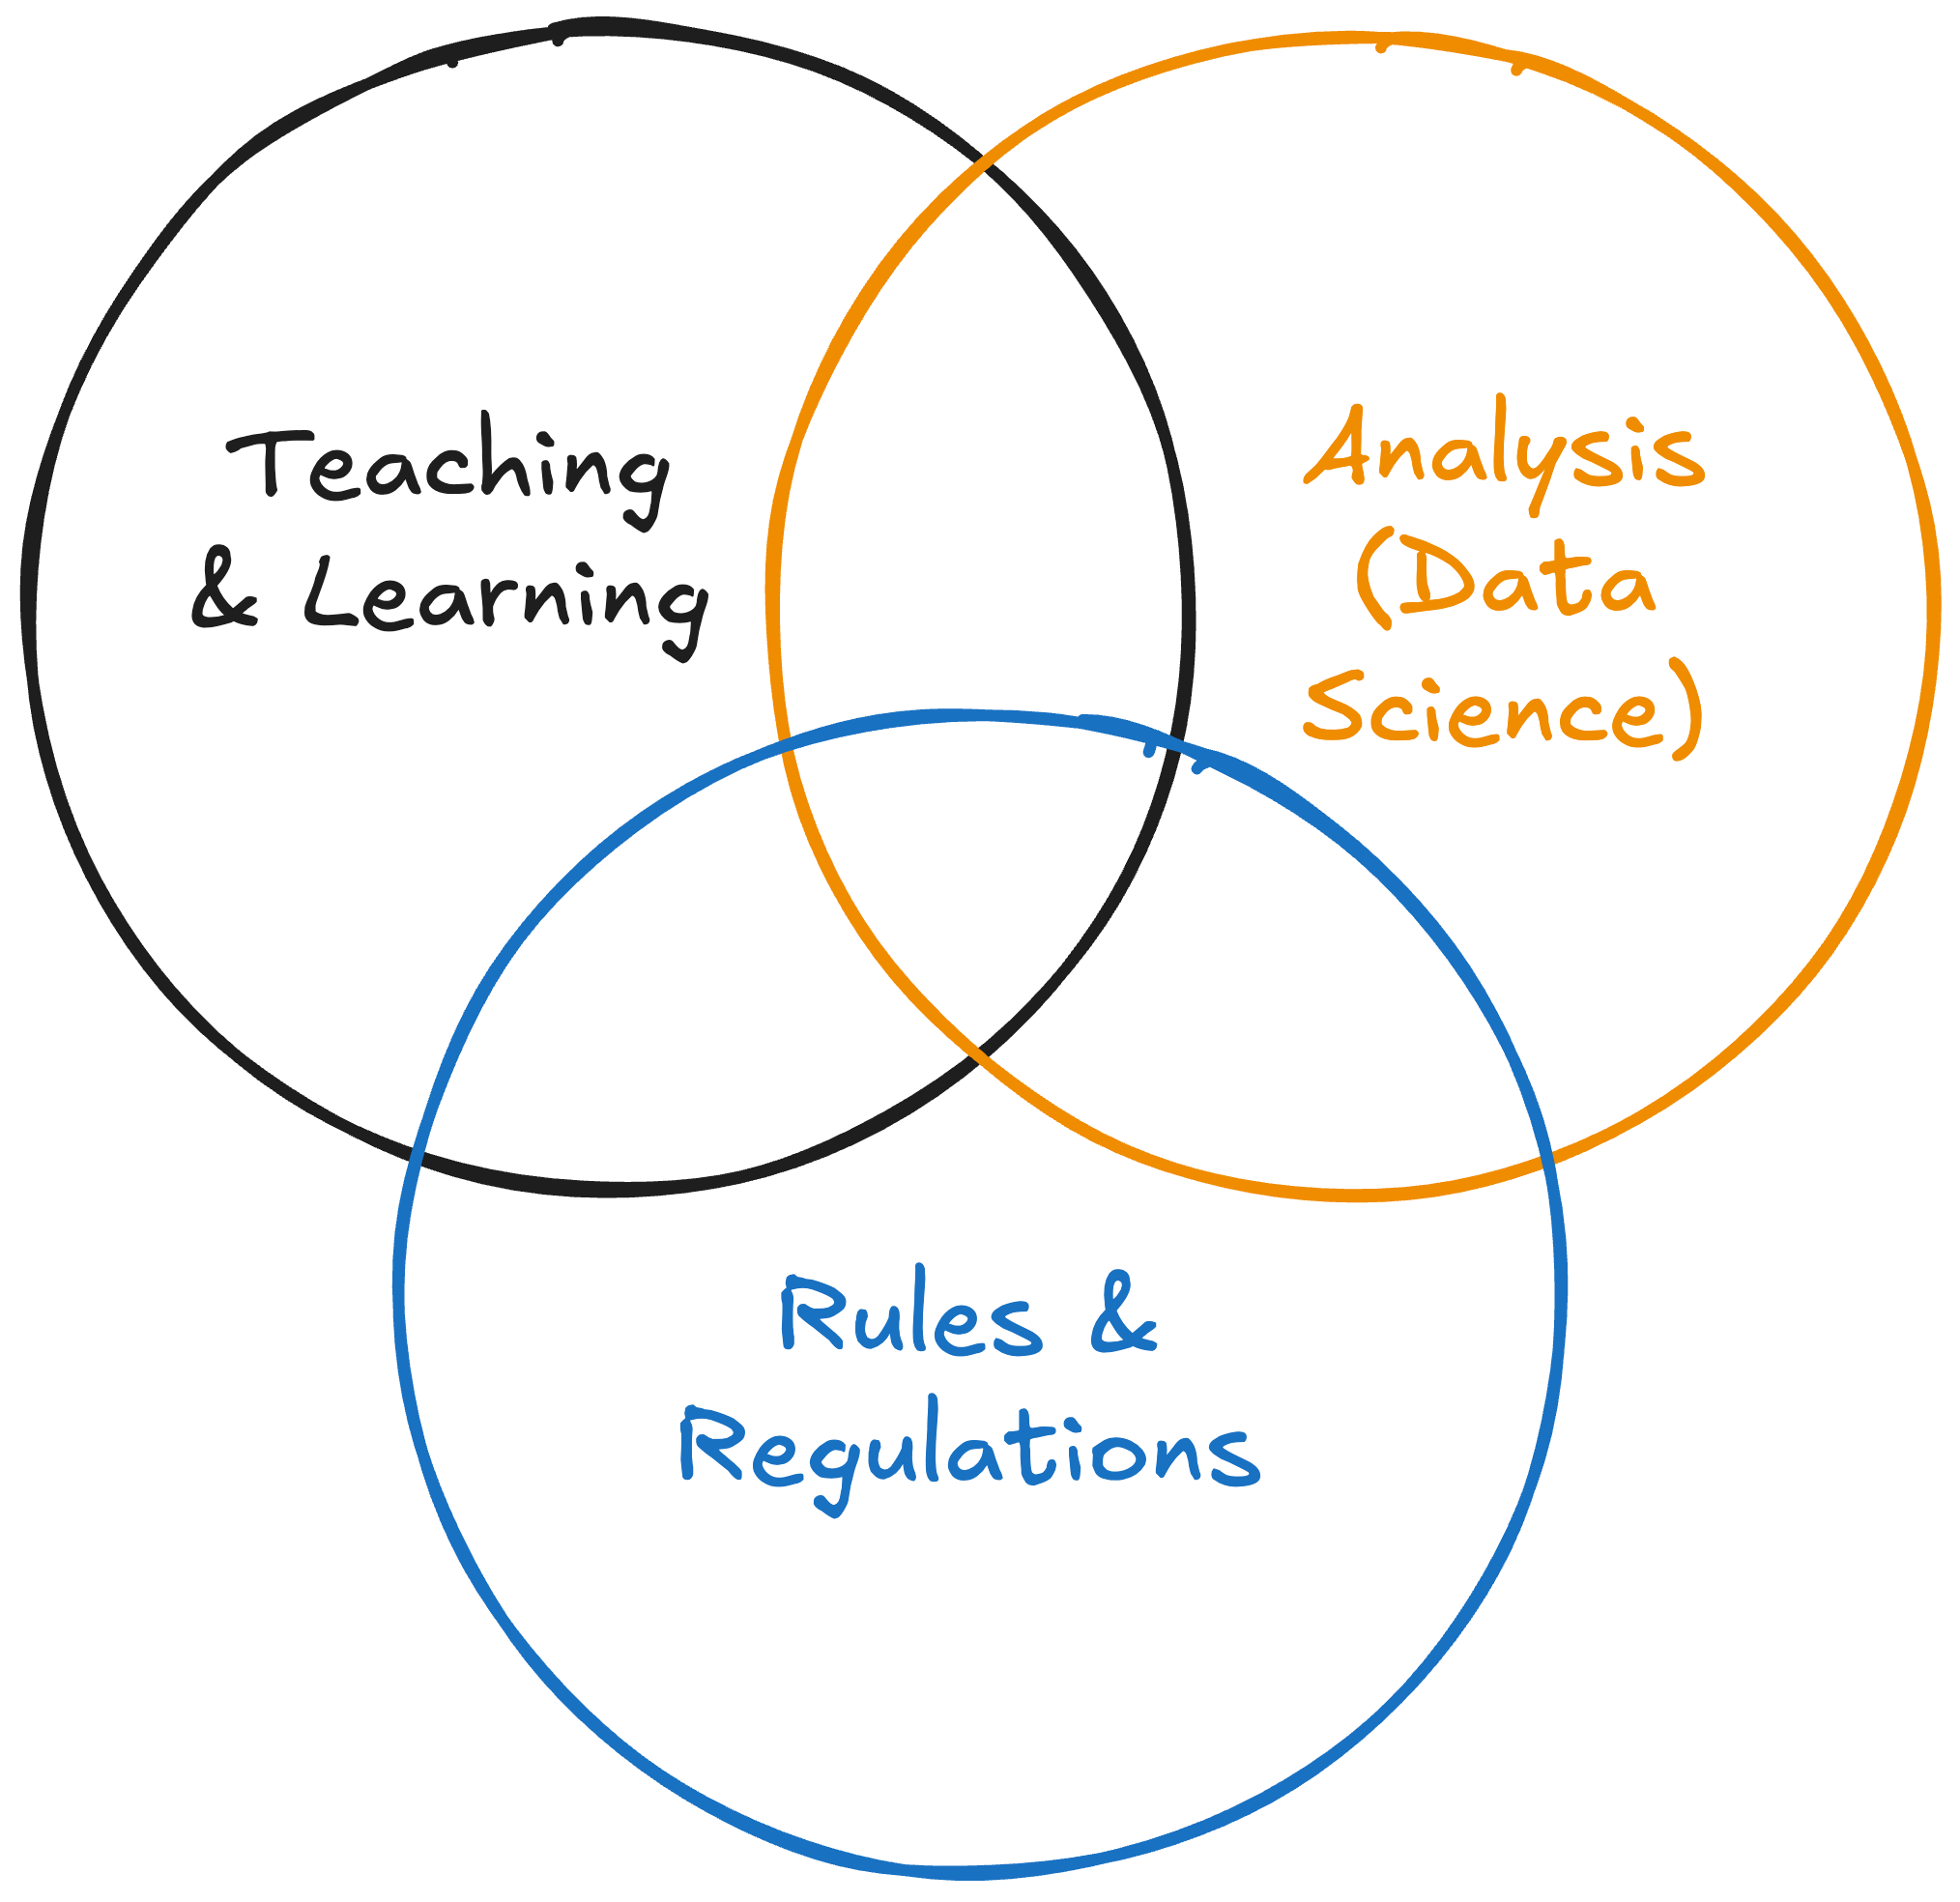
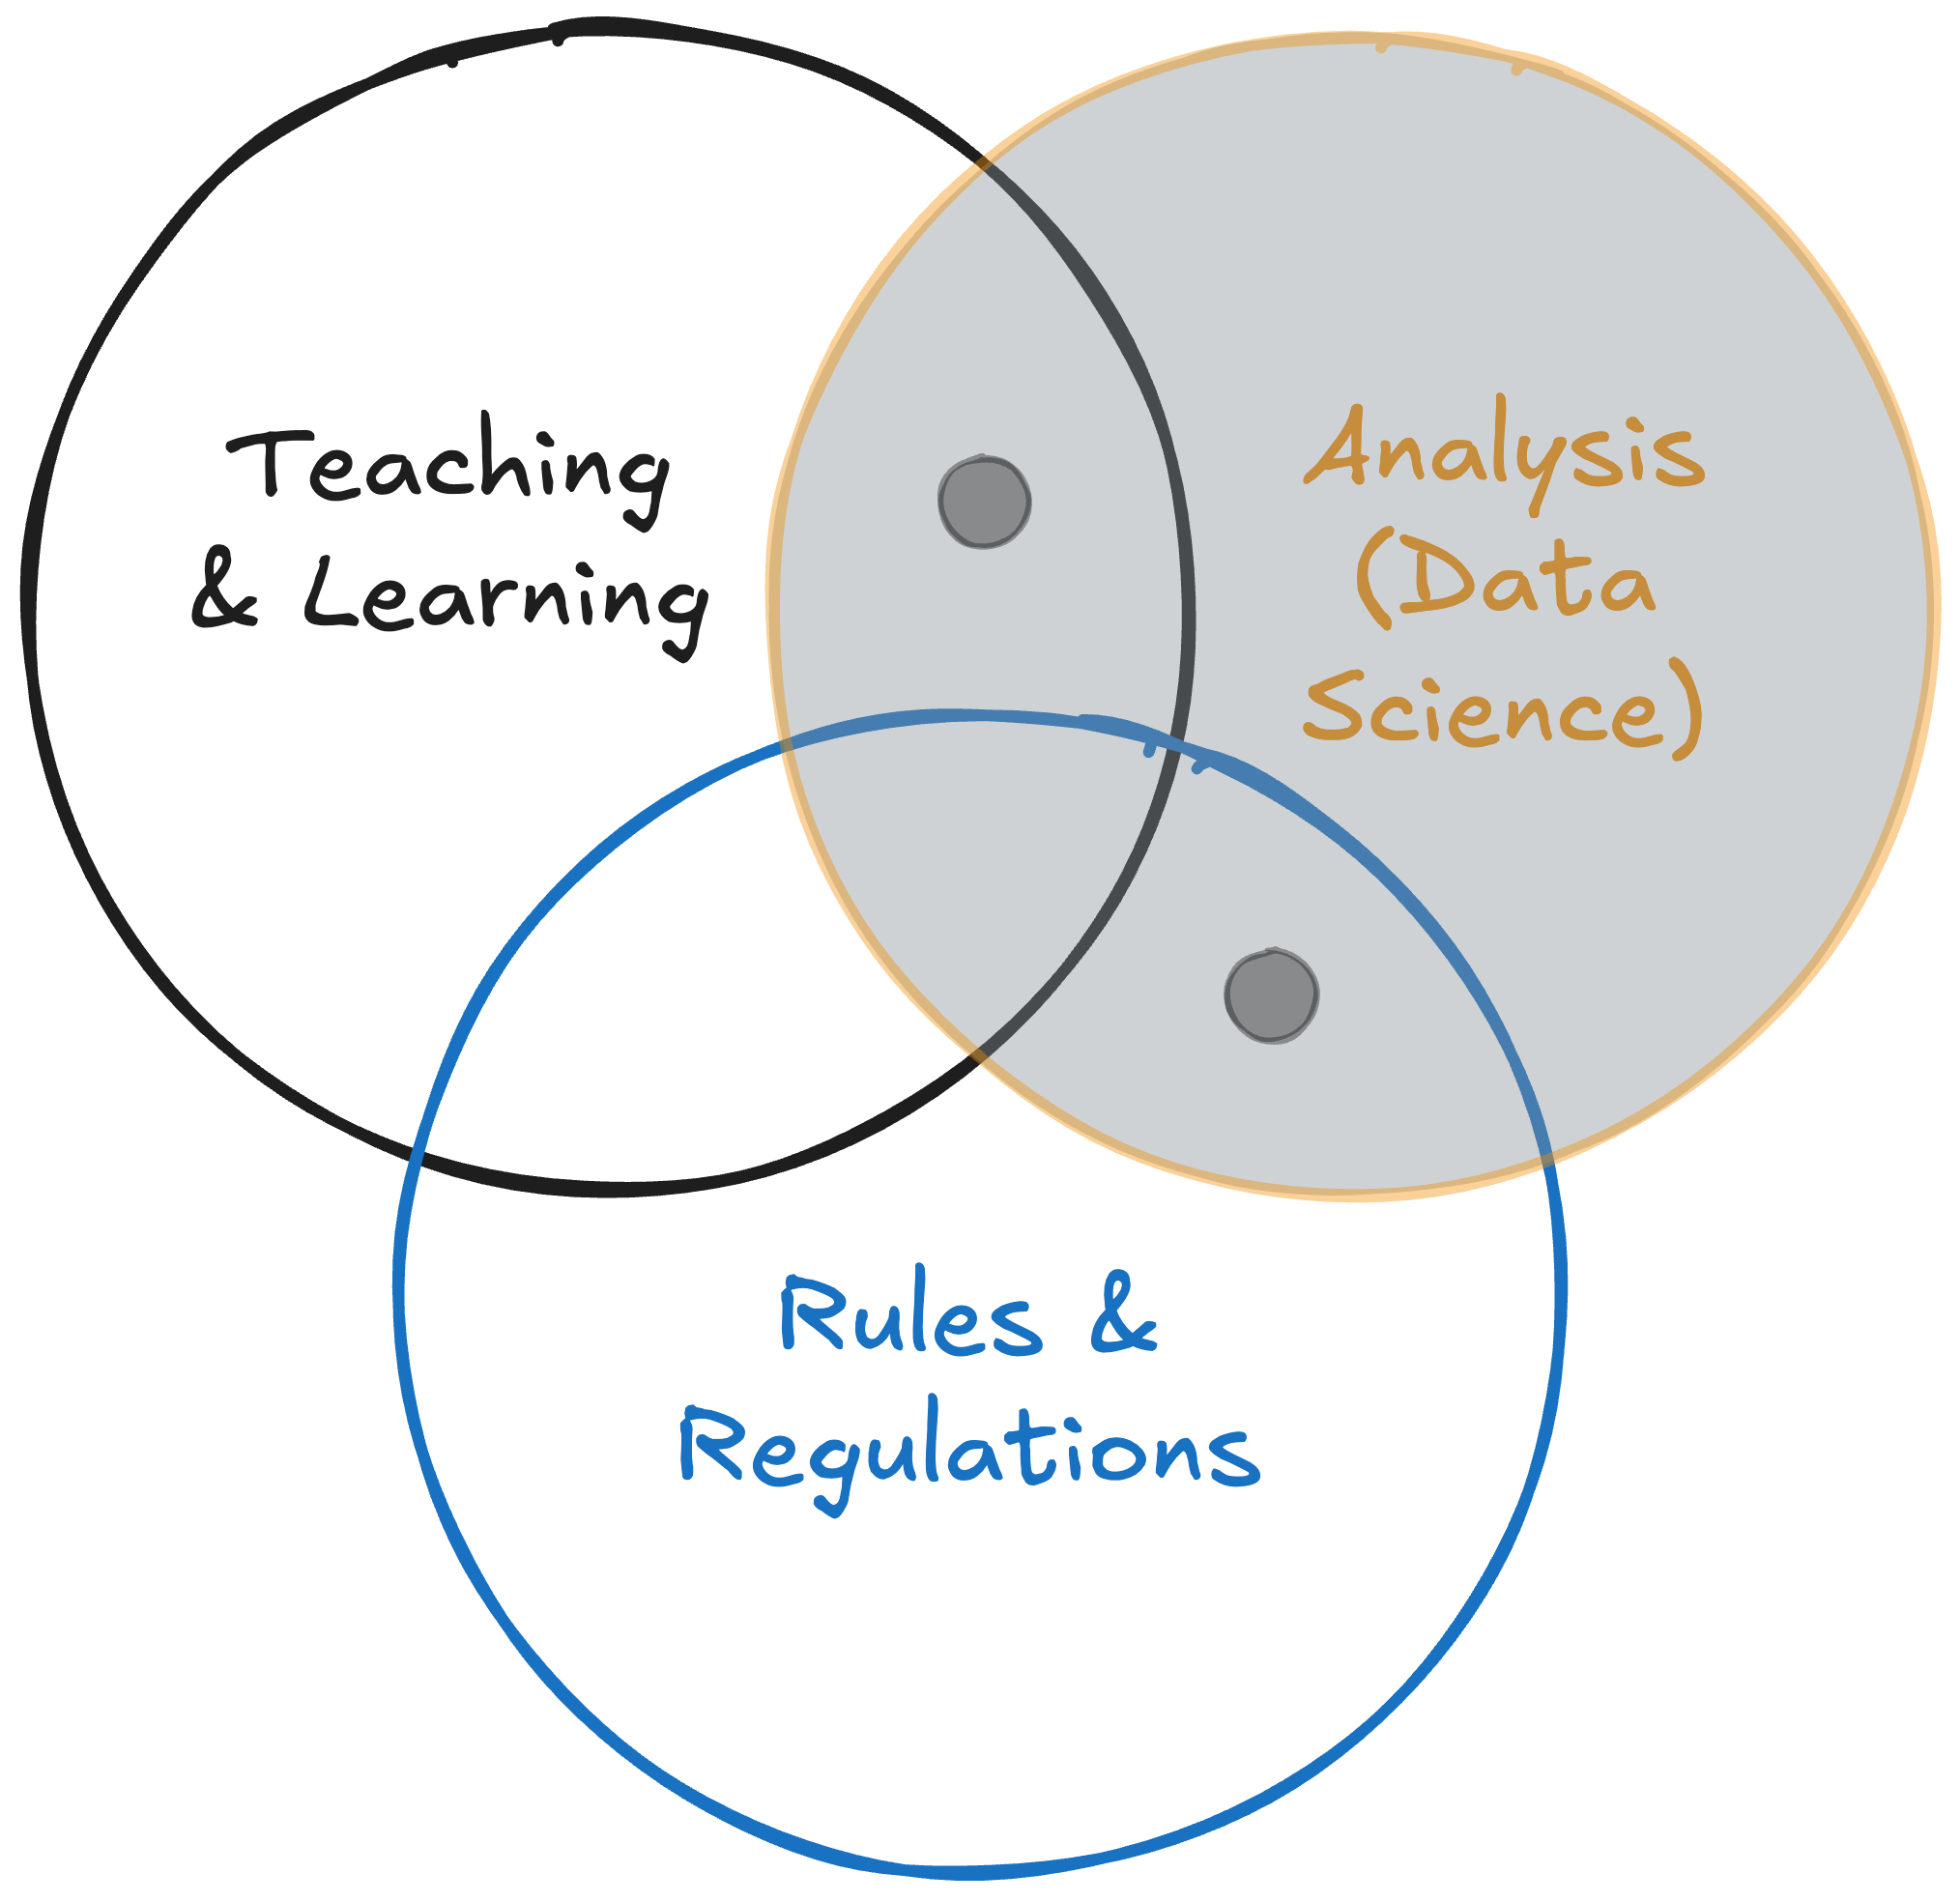
The focus here is on the analysis part of the job, which can overlap with what IR offices do.
Teaching & Learning: setting goals, working with faculty to use their observations and experiences to improve learning
Analysis: Data summaries and inferences
Regulation: Reporting requirements from accreditors
1.2 Data Science

- “Data Science for Assessment”, by Eubanks & Moore, to come in Assessment Update, Jan/Feb 2025 (vol 37, issue 1).
- “A manifesto for reproducible science”, by Mufano et al., Nature Human Behavior, 10-Jan-2017.
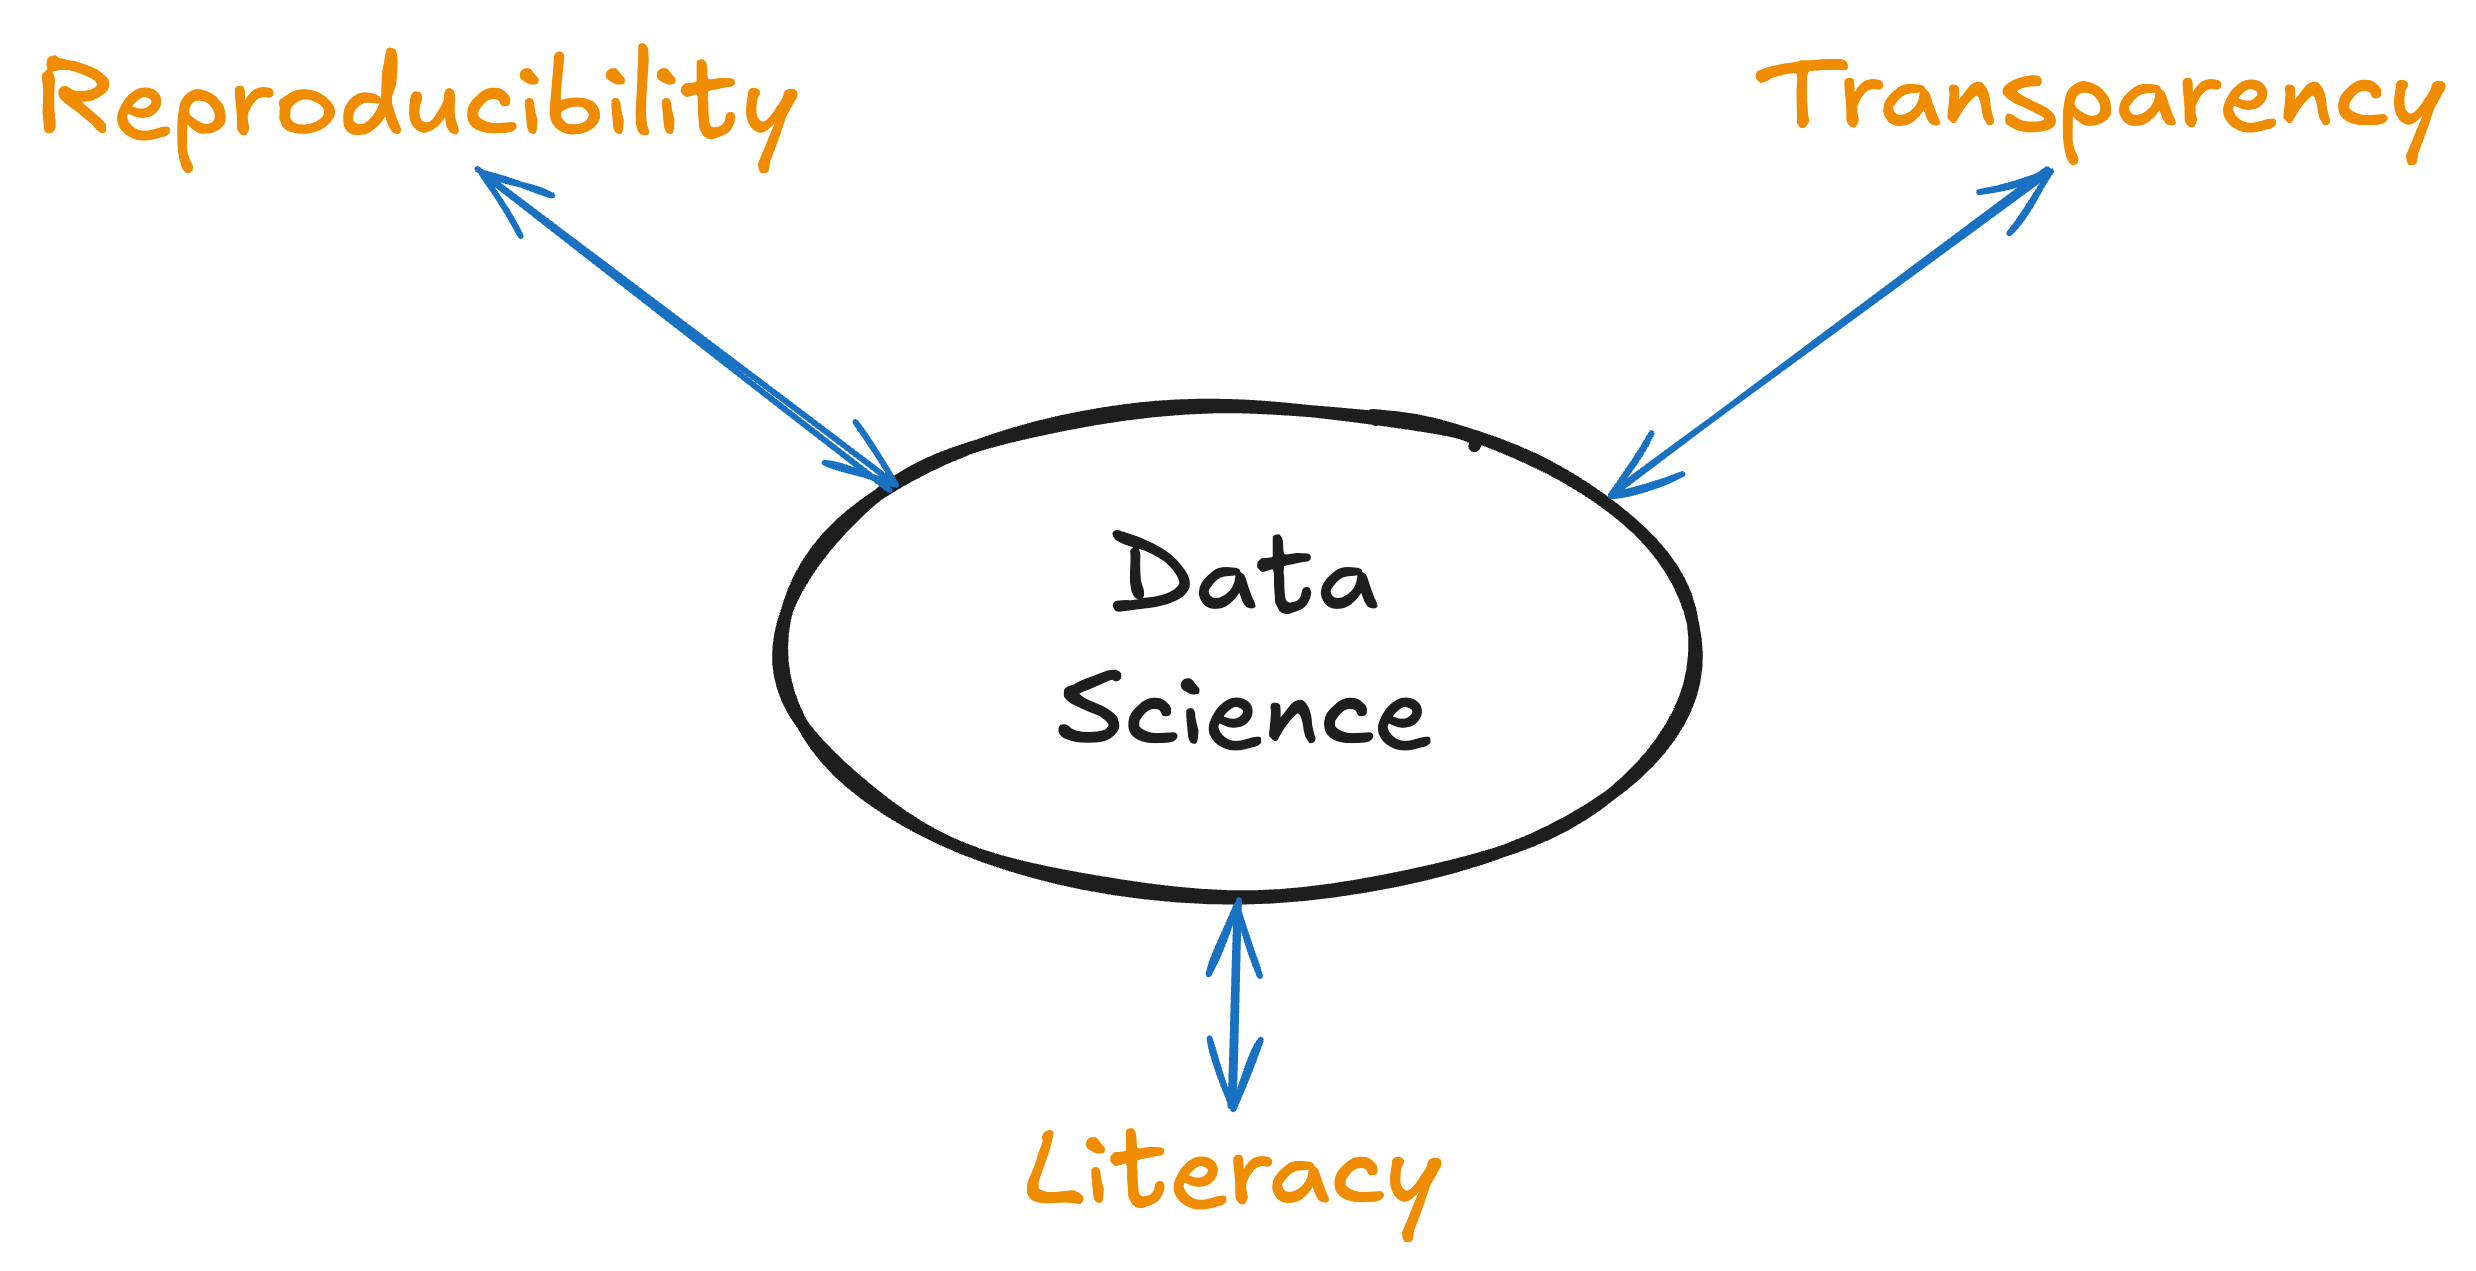
You may be aware of the reproducibility crisis that has identified research practices that lead to spurious conclusions. What we’re calling data science here is a blend of the emerging ideas about how to avoid those problems in combination with new automation tools.
- Reproducibility: can repeat a long sequence of steps without errors
- Transparency: can inspect every intermediate step to find errors and make improvements
- Literacy: computations are integrated with discussions and generated data displays.
1.3 Benefits
- Data Analysts
-
- Do analysis faster, more accurately, and reproducibly
- Use time saved to add depth to analysis
- Routine data work can be automated
- Assessment/IR Directors
-
- Make your organization more effective and have more impact
- Provides a buffer against tight budgets
- Professional development
2 Ways of Doing Analysis
- Demonstrate analysis done within Excel
- Demonstrate analysis done within
R- Notice reproducibility, transparency, and literacy
Scott gives a demo comparing Excel to R/Tidyverse.
- Emphasizes the point/click nature of Excel–great for short data-notepad jobs, but gets bogged down for long projects. Contrast to the instruction-based scripts in R.
- Do the same thing but we’re switching from point and click to description.
- R report
3 Examples
- Show actual workflow
- Recap benefits
- Again, note the benefits from reproducibility, transparency, and literacy
David demonstrates three or so real projects related to assessment and how he has gotten to this point.
4 Getting Started
- Support
- What to do
- How to get started — Assessment & IR focused
4.1 Support
- Community
- Resources
- Classes
4.2 What to do
- Get started: Success builds on success
- But also, over long term: Iterative improvement
- Software requirements
R: free to download and use- Databases that are free to download and use:
PostgreSQLandDuckDB - Can use
Rwith a database or without
4.3 How to get started – Assessment & IR focused
- RforIR.com
- Introductory workshops (see this link)
- “R Scripting”, “Visualization”, “Reporting”
5 Wrap-up
5.1 Where to find us
5.1.1 To chat
- Monday, 28-Oct, 9:30am Networking break, in the lobby
- Email:
5.1.2 Presentations
- Understanding Rater Agreement, David Eubanks, Mon 12:30pm, Lincoln
- The Grammar of Graphics, Scott Moore, Mon 1:45pm, Lincoln
- Keynote Session: Assessment and Accreditation, David Eubanks et al., Tues 8:15am, Marriott 6
5.2 Q&A
- This presentation is available on RforIR.com
